Archivo
3 Infografias: «Entendiendo los dígitos de las tarjetas de Crédito»
- Which Countries are Faced with a ‘Critical’ Health Worker Shortage?
- World According to Americans
- Cracking The Credit Card Code
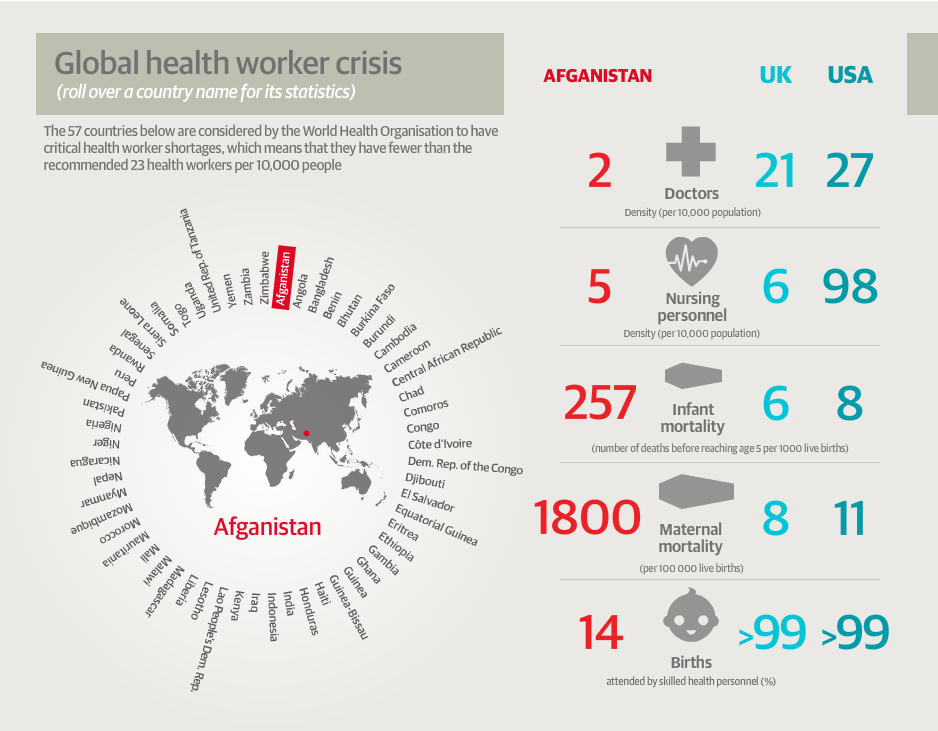
¿Qué países se enfrentan a una «crítica» por la escasez de los Trabajadores de la Salud?
Hay 57 países con menos de 23 trabajadores de la salud por cada 10.000 habitantes, como resultado del nacimiento de bebés y las tasas de mortalidad materna muy superior a la de los países desarrollados, como el Reino Unido y EE.UU.vía www.guardian.co.uk
(Haga clic en el enlace de arriba para ver los gráficos interactivos) |
Mundial de acuerdo a los estadonidenses
|
Descifrar el código de las tarjetas de crédito
Esta infografía muestra que lo que los 16 dígitos de números en las tarjetas de crédito significa realmente? Contrariamente a lo que usted puede pensar, que no son al azar. Los 16 dígitos están ahí por una razón y, conociendo algunas reglas simples, en realidad se podría aprender mucho de una tarjeta de crédito sólo por su número. vía www.mint.com |


5 Infografías: ¿Qué viene después de Wikileaks?
¿Qué sueños tienen los jefes y empleados para conseguir en el Año Nuevo? |
||||
¿Qué viene después de Wikileaks?
Las noticias sobre Wikileaks se están desarrollando todos los días. Esta es la última infografía que debe darle todo lo que necesita saber acerca de los principales actores en la búsqueda de mantener, ya sea el sitio en funcionamiento o cerrarla definitivamente ¿usted no sabe lo que es Wikileaks?. La televisión pública sueca, SVT, emitió la liberación de este documental de una hora de duración que relata la historia de Wikileaks. vía awesme.good.is
|


Infografía: Las Marcas más Virales del 2010
2010 ha sido sin duda un gran año para las marcas más virales. Después de un comienzo relativamente lento hasta la mitad del año sólo con la campaña de Old Spice sin añadir ningún sabor a la esfera del marketing digital, las cosas han tomado cuerpo en torno a la Copa del Mundo de fútbol con Nike y luego continuó con fuerza en el resto del año con Roger Federer en Gillette y disparó el viral y el pico con la serie de DC Shoe Gymkhana.
Una de las ideas más interesantes que hemos sacado en la infografía el cuadro viral de las Marcas es la triplicación acerca de las acciones en Facebook en el segundo semestre del año (en comparación con la primera mitad), y el consiguiente incremento de las * * opiniones-por-virales en consecuencia – lo que significa que si ahora sus campañas se hacen * * virales es más probable que mantenga su viralidad por más tiempo debido a la extensión más amplia de distribución dentro de Facebook.
De todos modos, espero que disfruten de esta infografía – que se basa en los datos semanales de viraladnetwork . Y si desea cualquier información más, están en @ Rubber_Republic.
![5279974224 c00143aca9 o Most viral brands of 2010 [infographic]](https://i0.wp.com/farm6.static.flickr.com/5081/5279974224_c00143aca9_o.jpg "Most viral brands of 2010 [infographic]")
Related Articles
- 25 Best Viral Videos of 2010 (thedailybeast.com)
3 Infografías: Cambio Climático y la Malaria; El costo de envío de dinero a casa, Estadística Twitter
- Cambio Climático y la Malaria, el escenario para el año 2050
- El costo de envío de dinero a casa
- Estadística Twitter para el año 2010, en comparación con 2009
| Cambio Climático y la Malaria, el escenario para el año 2050
Con las condiciones de cambio climático en el futuro, debido al aumento de las concentraciones de dióxido de carbono en la atmósfera, las condiciones para las plagas también cambian. El principal agente de la malaria, el parásito de la malaria por Plasmodium falciparum, será capaz de extenderse a nuevas áreas, como se muestra en este mapa, para el año 2050 utilizando el escenario Hadley CM2 alta. Otras áreas, no aparecen en el mapa, será inhabitable por el parásito, y por lo tanto libre de la plaga. a través de maps.grida.no
|
| El costo de envío de dinero a casa
Algunos migrantes 192m 3% de la población mundial enviaron remesas por un total de 316 mil millones dólares a países en desarrollo el año pasado, según el Banco Mundial. El costo del envío de remesas se correlaciona negativamente con el número de migrantes y proveedores de servicios en un país, la mayor competencia, menor será el costo. esta tabla muestra, para cada país, que es el país más caro para enviar $ 200 a. a través de www.economist.com
|
| Twitter Estadística para el año 2010, en comparación con 2009
Sysomos es el proveedor líder de monitoreo de los medios sociales y la liberación de la tecnología de análisis de un nuevo informe; echar un vistazo a cómo las personas usan Twitter, y lo compara con hace un año. examinaron 1.020.000.000 tweets hizo en un 20,3 millones de usuarios de Twitter. Algunos de los aspectos más destacados de el informe incluyen:
a través de sysomos.com |


Financial Flops of The Silver Screen (Infographie)
- Financial Flops of The Silver Screen
- Billionaires’ Favorite Politicians
- 100:One Hundred Years of Government Versus Economy
- What Companies Are Giving the Most Money to Political Candidates
- Which Actors Have Died the Most?
| Financial Flops of The Silver Screen
Creating a big, expensive epic that flops at the box office has got to be embarrassing. Depending on how bad the movie is and how badly it flops, it can destroy careers… Do the biggest box office failures lose a few million? Ten million? More? Much more. |
| Billionaires’ Favorite Politicians
The billionaires on the Forbes 400 list have given more than $30 million to politicians and political action committees since 2006, along with millions more in soft money to politically active groups. Although Forbes 400 members give about 15% more money to Republicans than Democrats, they fund groups across the political spectrum. via www.forbes.com |
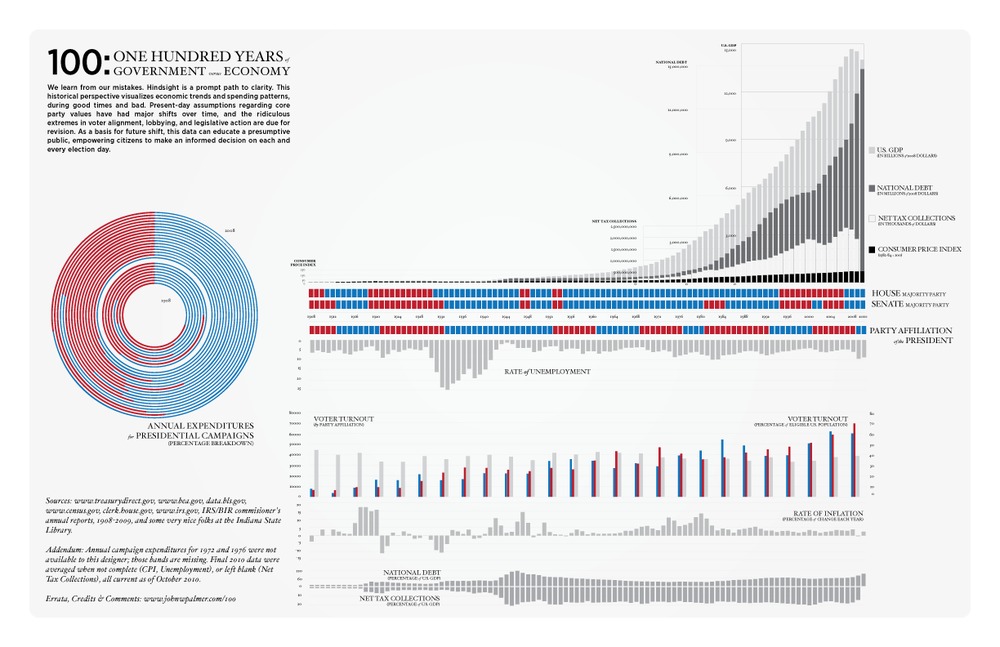
| 100:One Hundred Years of Government Versus Economy
John Palmer has a look at the past 100 years of government and economic indicators: Download pdf: 100.pdf |
| What Companies Are Giving the Most Money to Political Candidates
Every two years, good.is look at the candidates who have raised the most money while trying to represent us. In this year’s midterms, the representatives from each party are Charles Schumer (D-NY)—who is a shoo-in to keep his seat and has raised the most money of any Democrat—and Marco Rubio (R-FL) who is running against an independent former governor as well as a Democrat, and leading handily. This is what they would look like if they were forced to campaign in suits that made it clear to the world who their sponsors were, just like NASCAR drivers. via awesome.good.is |
| Which Actors Have Died the Most?
Here Lies 15 of Hollywood’s Most Killed Stars. Robert De Niro has died in 14 films which include: Bloody Mama, Bang the Drum Slowly, Mean Streets, Brazil, The Mission, Cape Fear, This Boy’s Life, Mary Shelley’s Frankenstein , Heat, The Fan, Jackie Brown, Great Expectations, 15 Minutes and Hide & Seek. via www.chacha.com
Articles: |


6 Infographies
- Halloween Celebration Around the World
- Evolution of Halloween
- The Business of Horror
- The Economics of Halloween
- History of Halloween
- World Foreign Prisoners percentage within the Prison Population
| Halloween Celebration Around the World
This map made by chartsbin.com shows halloween celebration around the world. via chartsbin.com |
| Evolution of Halloween
A timeline of the evolution of Halloween, including some fun facts about pumpkins and the ingredients and annual consumption of candy corn. |
| The Business of Horror
Halloween is one of America’s biggest revenue-generating holidays. And get this: the tradition thrived even during the spooky economy of the past couple of years. Costume sales jumped 5.1% in 2008 and another 2.4% in 2009. In this infographic, mint.com explore the economics of Halloween: read on, some of the stats may give you chills! via www.mint.com |
| The Economics of Halloween
Do Americans like candy? They like it to the tune of $20 billion a year! That’s right- Americans spend $20 billion on their sweet little vices. They’re out there night and day buying candy bars, chocolates, hardy candy and everything else that packs in the sugar. |
| History of Halloween
Halloween History gives you spooky details on the origins of Halloween, some of which goes back 2,000 years. |
| World Foreign Prisoners percentage within the Prison Population
This map made by chartsbin.com shows the percentage of foreign prisoners within each national prison population. Foreign prisoners includes men and women held in penal institutions, as pre-trial detainees (remand prisoners) or having been convicted and sentenced, in the world via chartsbin.com
Artículos relacionados |


Weave Data: How to Analyze Your Personal Internet Traffic? Infographie
- Weave Data: How to Analyze Your Personal Internet Traffic?
- Search Engine History
- The Varieties of Intimate Relationship
- The Evolution of the Geek
- How Google dominates the Web
- A Handy Alternative Therapy Flowchart
| Weave Data: How to Analyze Your Personal Internet Traffic?
We all use twitter, write emails, skype and blog all day long. There isn’t a single day we are not going to visit websites like google, youtube, the website of our favorite newspaper or social network and browse through the web. Despite that, or actually because of it, everybody tends to use the web in a different manner. To visualize this fact and the traces we leave on our journey through the internet and to reveal some of the hidden patterns of our everyday online life, weave magazine asked onformative to create a data visualization of the online activity of several interaction designers, artists and developers. By analyzing your personal internet traffic logfile using the custom written software you get a distinctive and unique visualization of your online activities. Collecting the Data : Download LogTool |
| Search Engine History
Nowadays we take the existence of search engines, especially Google (and Bing) as normal and for many among us a life without Google would be hard to imagine. But how did it come this far and how did search engines evolve over the last two decades? We looked at the history of the crawlers and if you thought there was only Google, Yahoo and Bing this infographic will show you how wrong you are. For the internet nerds among us, let this infographic take you on a trip down memory lane. |
| The Varieties of Intimate Relationship |
| The Evolution of the Geek
When one hears the word ‘geek’, images are conjured of pocket protectors and nightstands made out of old comic books. That old notion of geek-dom has since evolved into a new, tech-savy, and dare we say ‘cool’ geek’ via www.flowtown.com |
| How Google dominates the Web
Google began strictly as a search company, and it’s still their bread and butter. However, as the company has grown, it’s spread its tentacles like a giant octopus out to most parts of the Web. A benevolent giant octopus, providing lots of highly useful services, but a giant nonetheless. Try surfing the Web without touching a single Google service. It’s impossible. How Google dominates the Web?
|
| A Handy Alternative Therapy Flowchart
If perchance you are a little disillusioned with allopathy, here’s a handy little flowchart to help you find the ideal alternative therapy to meet your needs. This flowchart is made by Crispian Jago IT Consultant from Hampshire, United Kingdom. via Crispian Jago |


Related articles
- 10 Amazing SEO Infographics to Educate your Staff and Clients (famousbloggers.net)
- [infographic] The Evolution of the Geek (crenk.com)
- E-business, E-commerce y Social Media

Linear Layout for Visualization of Networks (Infographie)
- Linear Layout for Visualization of Networks
- Cuddle The Giant Panda
- The Gift of Generosity
- Information Graphic on Twitter
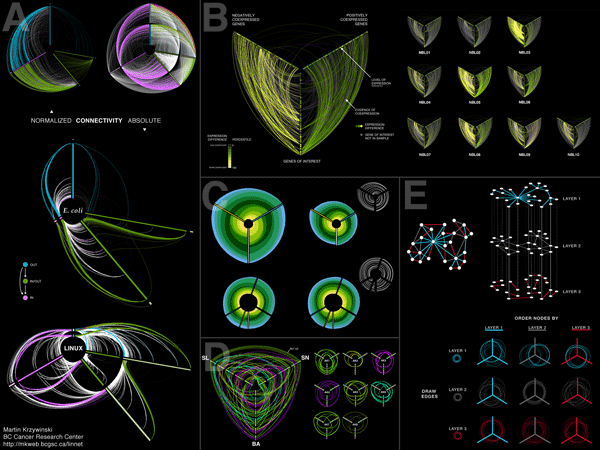
| Linear Layout for Visualization of Networks
The Linear Layout visualization is a productive approach to network visual analytics. It is a scalable, computationally fast, and straight-forward network visualization method that makes possible visual interpretation of network structure and evolution. Solution: The linear layout presented here addresses the shortcomings of the conventional hairball layout and is very effective at identifying meaningful structural components in your network.
via linnet |
| Cuddle The Giant Panda
Who would not look in awe and amazement at the sight of a beautiful Giant Panda! The rarity of this solitary animal found in China and the danger it faces as an endangered species, make it all the more awe-inspiring. Here are some interesting facts you would want to know about these lovely creatures: |
| The Gift of Generosity
This is a kinetic typography about ‘The Gift of Generosity’ made by epipheostudios. Life is a gift, a blessing. And yet we get so caught up in the day to day that we forget to pass that blessing along. Our challenge: To use text in a dynamic way to reawaken in us a thankfulness for life and a desire to pass our blessings along. Letting the story of our blessing become the story of someone else’s blessing. |
| Information Graphic on Twitter
Twitter’s overnight Internet fame stems from one simple question: «What are you doing?» You have 140 characters of text to answer, and as soon as you hit Update, the site’s millions of users can see what you’re up to. This small idea has blossomed into a hugely popular phenomenon, with its users covering the entire Earth, developers creating scores of helper apps for it, and a raft of imitation sites. It’s growth has certainly been impressive since last year. Information Graphic on Twitter is an infographic university project made by Melanie Stirner graphic designer from Germany, Trier. This exclusive infographic breaks down some of statistics on years/month, entire tweets, daily tweets, number of signs, crime rate, spam, security gaps, followers, following and languages. via Melanie Stirner Note: This infographic is in German Language. |


Related articles
- How are Infographics made ? (dailybloggr.com)

